

Build a personal project for quant trading interview discussions around one testable market hypothesis, a simple baseline, and a chronological evaluation you can reproduce. For your 2026 applications, present the assumptions, results, and failure cases—not just a return chart—and distinguish simulated trading from evidence that a strategy works in live markets.
- A personal project for quant trading interview prep needs a defensible hypothesis, not an impressive-looking backtest.
- Keep quant interview prep focused: explain data timing, a baseline, execution assumptions, and failed tests.
- QuantMinds provides quant finance career coaching; use coaching for feedback, not as a substitute for original research.
- Choose a small project you can reproduce and defend without opening your notebook.
Why this matters
A project gives you something concrete to discuss: how you framed uncertainty, wrote code, tested an idea, and changed your mind. Its value comes from the decisions you can explain, not the sophistication of the model name.
Treat your 2026 project as evidence of research judgment, not a claim that you have discovered a tradable strategy. A clean negative result supports an honest discussion; an unexplained positive result leaves basic questions unanswered. Use the guide to explaining a research project in a quant interview to prepare the explanation alongside the code.
How do you build a personal project for a quant trading interview?
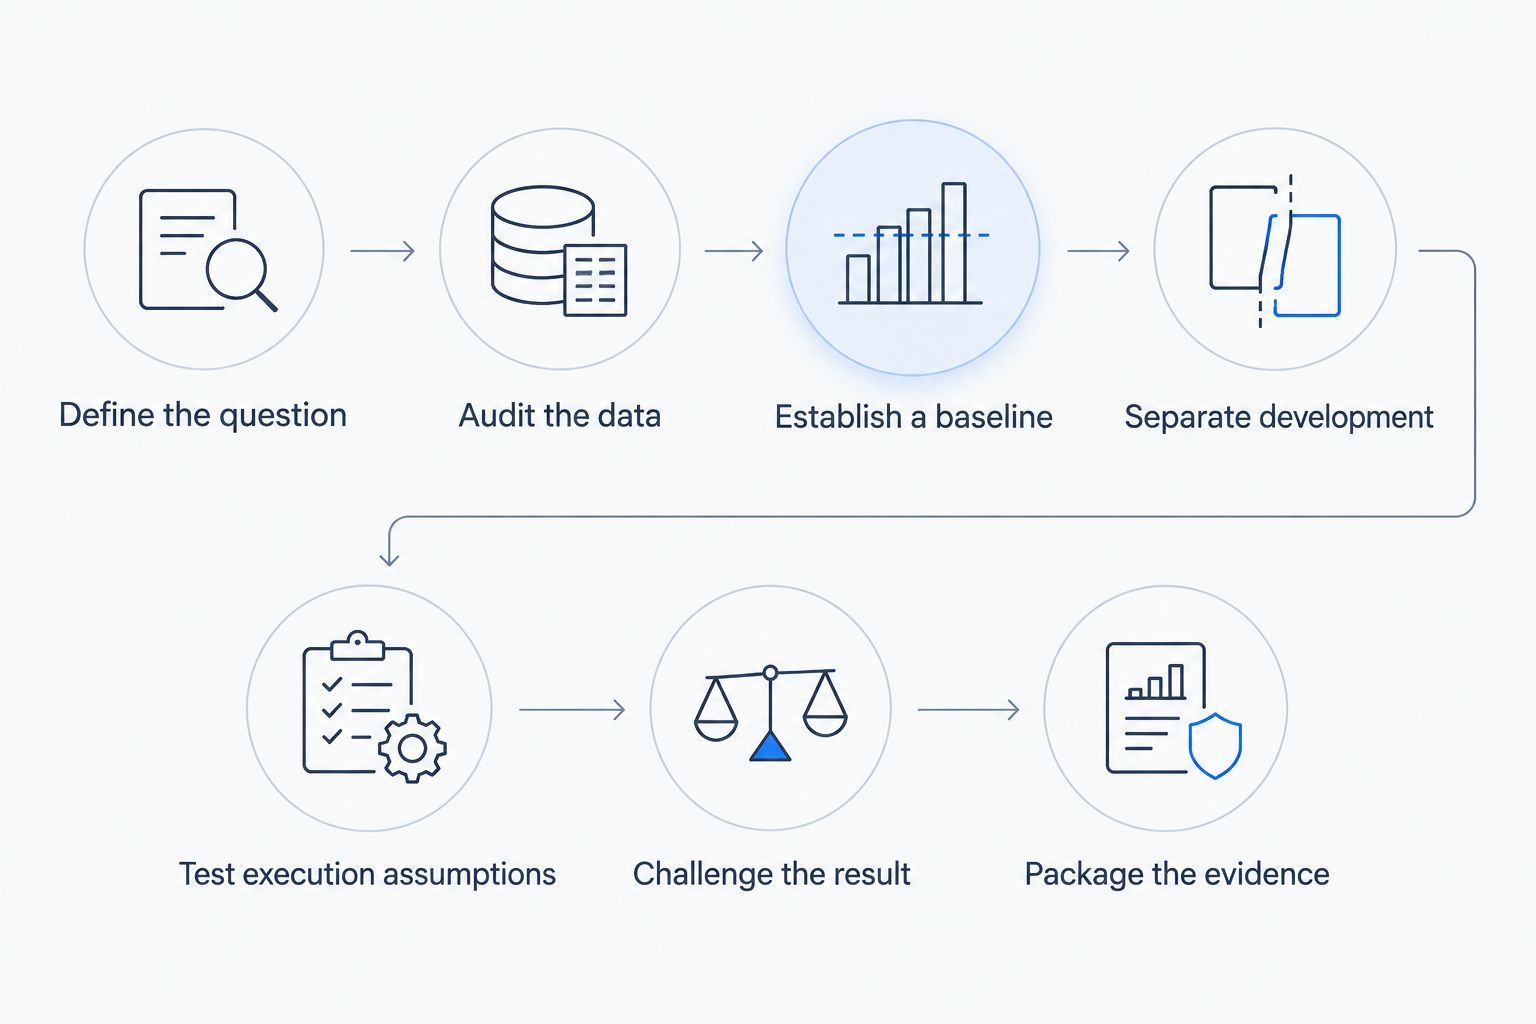
Follow this sequence: define the question, audit the data, establish a baseline, separate development from evaluation, test execution assumptions, and package the evidence. Do not add model complexity until the simpler experiment is correct.
1. Define the question
Write a hypothesis that specifies the information available, the decision being made, and the outcome being measured. For example, investigate whether a past-return signal predicts subsequent returns after an explicit execution delay; do not start with the vague goal of building a profitable trading bot.
Define what would count against your hypothesis before looking at the final evaluation. That might be performance no better than the baseline, instability across evaluation periods, or a result that disappears under your execution assumptions.
Keep the scope narrow. Choose a market, observation frequency, and decision rule that your data actually supports; leave portfolio optimization and live deployment outside the first version unless they are the research question.
2. Audit the data
Record the source, coverage, timestamp convention, missing observations, and treatment of corporate actions where relevant. Distinguish when an event happened from when its information became available to your strategy.
A close-based signal cannot assume execution at that same closing price without a defensible execution mechanism. Likewise, a historical universe built from today's surviving securities introduces survivorship bias.
Save a fixed data snapshot for your 2026 project and document how you obtained it. Check the source's usage terms before sharing data publicly; if redistribution is restricted, publish retrieval instructions and permitted examples instead.
3. Establish a baseline
Implement the simplest comparison that answers the same question under the same constraints. A forecasting project needs a naive forecast; a trading-rule project needs a clearly defined reference strategy.
Apply the same evaluation dates, position restrictions, and accounting conventions to both. A comparison is misleading when one approach receives favorable assumptions that the other does not.
Write tests before expanding the model. Check that a zero position produces zero trading profit, that reversing a position reverses its price exposure before costs, and that changing future observations cannot alter earlier decisions.
4. Separate development from evaluation
Use earlier observations for development and later observations for evaluation. Fit transformations, choose parameters, and select features without using the final evaluation period.
Chronological ordering is necessary, but it does not fix every leakage problem. Labels that span an interval can overlap a split boundary; remove or separate overlapping observations so training labels do not consume evaluation-period information.
Record every material experiment, including unsuccessful versions. Once you inspect a holdout and use it to revise the strategy, that period has become part of development rather than untouched evidence.
5. Test execution assumptions
Connect the signal to an explicit decision timeline: information arrives, the strategy computes a position, an order becomes eligible, and an execution assumption determines the fill. Show where uncertainty enters.
Include trading frictions supported by your data, or state that your analysis is gross of those frictions. If you run hypothetical friction scenarios, label them as assumptions rather than observed execution estimates.
Inspect turnover, position exposure, drawdown, and dependence on individual observations. A return summary alone does not explain whether the result comes from persistent behavior, concentrated risk, or an implementation mistake.
6. Challenge the result
Change assumptions that matter to the hypothesis: the signal window, execution delay, evaluation period, or treatment of missing data. Explain why each check is relevant before interpreting its outcome.
Do not search for the variation that makes the chart look best. Use sensitivity analysis to identify where the conclusion stops holding, and disclose the choices you explored.
Write the failure analysis even if the strategy performs poorly. Distinguish an economic idea that lacks support from a test that cannot answer the question because the available data is inadequate.
7. Package the evidence
Deliver a readable repository, a reproducible analysis, and a short research memo. Include environment instructions, data retrieval steps, tests, and a clear entry point for regenerating the results.
For a 2026 application, prepare a 1-page brief explaining the question, method, finding, and limitation. Also rehearse a 2-minute explanation that works without slides; these are practical preparation targets, not employer requirements.
Keep the resume claim narrower than the evidence. Describe what you implemented and evaluated, and include measured results only when your saved outputs support them.
The project should have a visible chain of reasoning. Someone reading the memo should be able to trace the conclusion back through the evaluation, baseline, data, and original question.
Which project should you choose?
Choose the project whose assumptions you can explain. The following are suggested formats, not claims about what a particular employer requires.
| Project format | Best for | What it demonstrates | Main limitation |
|---|---|---|---|
| Signal study | Candidates emphasizing statistical research | Hypothesis testing, chronological evaluation, and uncertainty | A predictive relationship does not establish executable profit |
| Market-making simulator | Candidates emphasizing trading decisions | Inventory management and decisions under uncertain fills | Results depend on the simulated market and fill rules |
| Execution simulator | Candidates emphasizing implementation | Order handling, accounting, and reproducible event processing | Simplified market behavior limits real-world conclusions |
Signal study: best for statistical research
Test a narrowly defined relationship between information available at decision time and a later outcome. Begin with an interpretable model and explain why the target and baseline match your question.
The advantage is a direct discussion of statistical reasoning. The limitation is the gap between prediction and trading: even a useful forecast needs execution, exposure control, and an economic interpretation. Choose this format when you can defend the evaluation, not just fit the model.
Market-making simulator: best for trading decisions
Build a simplified environment in which quoted prices, inventory, and uncertain fills affect outcomes. Compare a fixed quoting rule with an inventory-aware rule under identical simulated conditions.
The advantage is a clear decision problem. The limitation is realism: a fill rule that rewards your quoting policy can manufacture success. Choose this format when you are ready to challenge the simulator itself.
Execution simulator: best for implementation
Implement a small event-driven system that accepts orders, updates positions, and calculates cash and exposure consistently. Define how partial fills, cancellations, and unavailable liquidity are handled.
The advantage is inspectable engineering work. The limitation is that correct accounting does not establish a trading edge. Choose this format when implementation is your strongest evidence, and keep the financial claims modest.
Why project scope varies
Set the scope around the evidence you can produce, not the number of features you can add. Use these factors to decide what belongs in the first version:
- Target role: Research questions, trading decisions, and systems implementation require different demonstrations.
- Data resolution: Daily observations cannot establish order-book behavior or intraday fill quality.
- Data rights: Redistribution restrictions change what you can include in a public repository.
- Existing skills: Use methods you can derive, implement, and explain before adding unfamiliar machinery.
- Evaluation difficulty: Overlapping labels, changing universes, and execution assumptions require additional controls.
- Interview readiness: Leave room to rehearse limitations and reproduce the result, rather than continually expanding the build.
What should you put on your resume?
Use a project bullet that identifies the research question, your implementation, and the evaluation method. Add an outcome only when it is measured and reproducible; do not turn a simulated result into a claim about live trading.
A useful structure is: investigated a defined hypothesis, implemented a named method, evaluated it chronologically against a stated baseline, and documented the principal limitation. Replace each part with your actual work rather than copying a generic claim.
For your 2026 recruiting materials, make ownership explicit. Identify borrowed components and your original contribution, including changes to the data pipeline, evaluation, or simulator.
QuantMinds is best for students and professionals seeking quant finance career coaching on resumes and interview preparation. Its services include resume review, interview prep, and 1-on-1 coaching; feedback does not replace doing the research or guarantee an offer. Use QuantMinds when you need help connecting your evidence to your target role.
How should you defend the project in an interview?
Start with the question and your finding, then explain the test that connects them. Keep implementation details available, but do not begin by listing libraries or reading the repository structure aloud.
Rehearse 3 checks: explain when each input became available, justify the baseline, and identify the assumption most likely to change your conclusion. Treat these as a preparation exercise, not a universal interview format.
When challenged, separate what you measured from what you assumed. If the question exposes a genuine weakness, explain the additional experiment needed rather than defending an unsupported claim.
What if the strategy loses money?
A losing result is still usable when the experiment is sound and the conclusion is honest. Explain whether the hypothesis failed, the assumed trading frictions erased the result, or the data could not support the intended test.
Do not keep changing parameters until the loss disappears. A documented rejection shows more clearly what you learned than a selected winning chart with no experiment history.
FAQ
What's the best personal project for a quant trading interview?
The best personal project for a quant trading interview is a narrow experiment you can reproduce and defend. Choose a signal study, market-making simulator, or execution simulator according to the skills you want to demonstrate.
Do I need a profitable strategy for my quant trading project?
You do not need to present a profitable strategy to explain a rigorous research project. Report the actual result, distinguish simulated performance from live trading, and explain what the evidence supports.
Can I use daily data instead of order-book data?
Use daily data when your research question operates at daily frequency. Do not use daily observations to claim evidence about intraday liquidity, queue position, or realistic order-book fills.
How do I prevent look-ahead bias in a trading project?
Make every decision depend only on information available at that decision time. Audit publication timing, signal construction, fitted transformations, label overlap, and execution assumptions.
Can I start from a tutorial or an existing repository?
You can use existing work as a starting point if you follow its license and disclose what you borrowed. Identify your own contribution and be ready to explain the inherited components you use.
Should I publish the full dataset with my project?
Publish the dataset only when its usage terms permit redistribution. Otherwise, provide lawful retrieval instructions and enough documentation to reproduce the analysis with authorized access.
Can coaching help me present a quant project?
QuantMinds provides resume review and interview preparation for quant finance candidates. Use that feedback to improve your explanation while keeping the research, code, and claims your own.
One last thing
Before your 2026 interview, remove the headline return chart and try explaining the project. Can you still state the question, justify the test, and describe what failed?
If the project only sounds convincing when the chart is visible, improve the reasoning before adding another feature.