

Answer time series questions in a quant interview by stating the target and information available, checking assumptions, deriving a simple model, and explaining how you would validate it without future information. Separate predictability of returns from predictability of volatility. A correct formula is incomplete without its assumptions and a credible out-of-sample test.
- For time series questions quant interview preparation, connect stationarity, forecasting, and chronological validation rather than memorizing definitions.
- An AR(1) model explains persistence; GARCH models conditional variance, not automatically expected returns.
- QuantMinds provides quant interview prep; technical practice still requires you to derive, code, and defend your answers.
- State when each feature becomes observable before proposing a backtest.
How do you answer time series questions in a quant interview?
Use this sequence for your 2026 preparation. It works for a theoretical derivation, a forecasting exercise, or a discussion of your research.
- Define the target. Specify prices, returns, volatility, or a spread, along with the forecast horizon. Connect the statistical reasoning to your broader statistics interview preparation.
- State the information set. Identify what is observable at the prediction timestamp. A measurement timestamp and a publication timestamp are not necessarily the same.
- Check the assumptions. Discuss stationarity, serial dependence, seasonality, and changing variance where relevant. Distinguish a modeling assumption from evidence supporting it.
- Derive a baseline. Write the simplest defensible model and explain its parameters. Do not name a complicated model before explaining what it adds.
- Validate chronologically. Fit preprocessing and model parameters using training information only. Compare against a relevant baseline on later observations.
- Explain failure conditions. Address parameter instability, residual dependence, leakage, and the difference between statistical accuracy and trading usefulness.
Make the reasoning visible. If a question is ambiguous, ask whether the interviewer wants a population result, an estimator, or an implementation.
Why this matters
A time series model links observations across time. That dependence changes how you estimate uncertainty, construct validation sets, and interpret apparent patterns.
For your 2026 interview preparation, distinguish mathematical correctness from research validity. You can derive an estimator correctly and still evaluate it using information that would not have existed when the forecast was made.
Start with the decision the forecast supports. Predicting tomorrow's return, estimating tomorrow's variance, and identifying a stationary spread are different problems; one model does not answer all of them.
How should you explain stationarity?
Weak stationarity requires a constant finite mean and an autocovariance that depends on lag rather than calendar time. The variance is therefore constant as well. Strict stationarity requires joint distributions to remain unchanged under time shifts; it is a stronger distributional requirement, not just a statement about moments.
Do not call a series stationary because its plot looks stable. A plot is a diagnostic, not a proof, and a finite sample cannot establish every population property.
For a random walk, x_t = x_(t−1) + ε_t, independent zero-mean innovations accumulate. With a fixed starting value and innovation variance σ², the variance of x_t grows with t, so the process is not weakly stationary.
Differencing gives Δx_t = ε_t. Under those assumptions, the differenced process is stationary. Differencing changes the modeling target; it does not guarantee that every transformed financial series becomes stationary.
If asked about testing, explain the null hypothesis. The augmented Dickey–Fuller test has a unit-root null; failure to reject is not proof that the null is true. Deterministic terms and lag specification affect the test you are conducting.
How do you derive and interpret an AR(1) model?
Write the model before discussing its behavior:
x_t = c + φx_(t−1) + ε_t, with innovations having conditional mean zero given past information and constant variance σ².
For the stationary causal solution, |φ| < 1. Taking expectations gives μ = c + φμ, so μ = c / (1 − φ). Centering the process and using the innovation assumptions gives Var(x_t) = σ² / (1 − φ²).
The lag-k autocorrelation is φ^k for nonnegative integer k. Positive φ produces persistence; negative φ produces alternating autocorrelation. Neither statement establishes a profitable trading strategy.
The h-step conditional mean forecast is μ + φ^h(x_t − μ). Explain its behavior: as the horizon increases, the stationary model's forecast approaches its unconditional mean.
If the interviewer moves φ toward one, distinguish slow decay from a unit root. At φ = 1, the stationary mean and variance formulas no longer apply. Do not substitute into a formula outside the assumptions used to derive it.
Which model should you choose?
Choose the model for the quantity being modeled, not because its acronym sounds more advanced. This comparison belongs in a 2026 study plan because conditional mean and conditional variance answer different questions.
| Model | Best for | What you explain | Main limitation |
|---|---|---|---|
| AR(1) | A simple persistence baseline | Dependence on the previous observation | A single lag restricts the dependence structure |
| ARIMA | Linear dynamics after specified differencing | Autoregressive terms, differencing, and moving-average errors | Differencing and order choices require justification |
| GARCH | Time-varying conditional variance | Variance responding to past shocks and variance | A variance forecast does not establish return predictability |
| Cointegration model | Long-run relationships among integrated series | A stationary linear combination and adjustment dynamics | Apparent relationships require testing and stability checks |
ARIMA's moving-average component refers to lagged innovations, not a rolling average of observations. State that distinction explicitly if asked to interpret the model.
For a standard GARCH(1,1), write h_t = ω + αε²_(t−1) + βh_(t−1). Under the usual nonnegative parameter restrictions, α + β < 1 gives a finite unconditional variance of ω / (1 − α − β). This condition concerns the second moment; it is not a complete description of every stationarity property.
Cointegration is not high correlation. Integrated series can share a stationary linear combination, but a high sample correlation alone does not establish that relationship.
How do you validate a time series forecast without leakage?
Reconstruct what you would have known at each prediction time. Keeping observations in chronological order is necessary for a historical forecasting evaluation, but it does not fix incorrectly timestamped features.
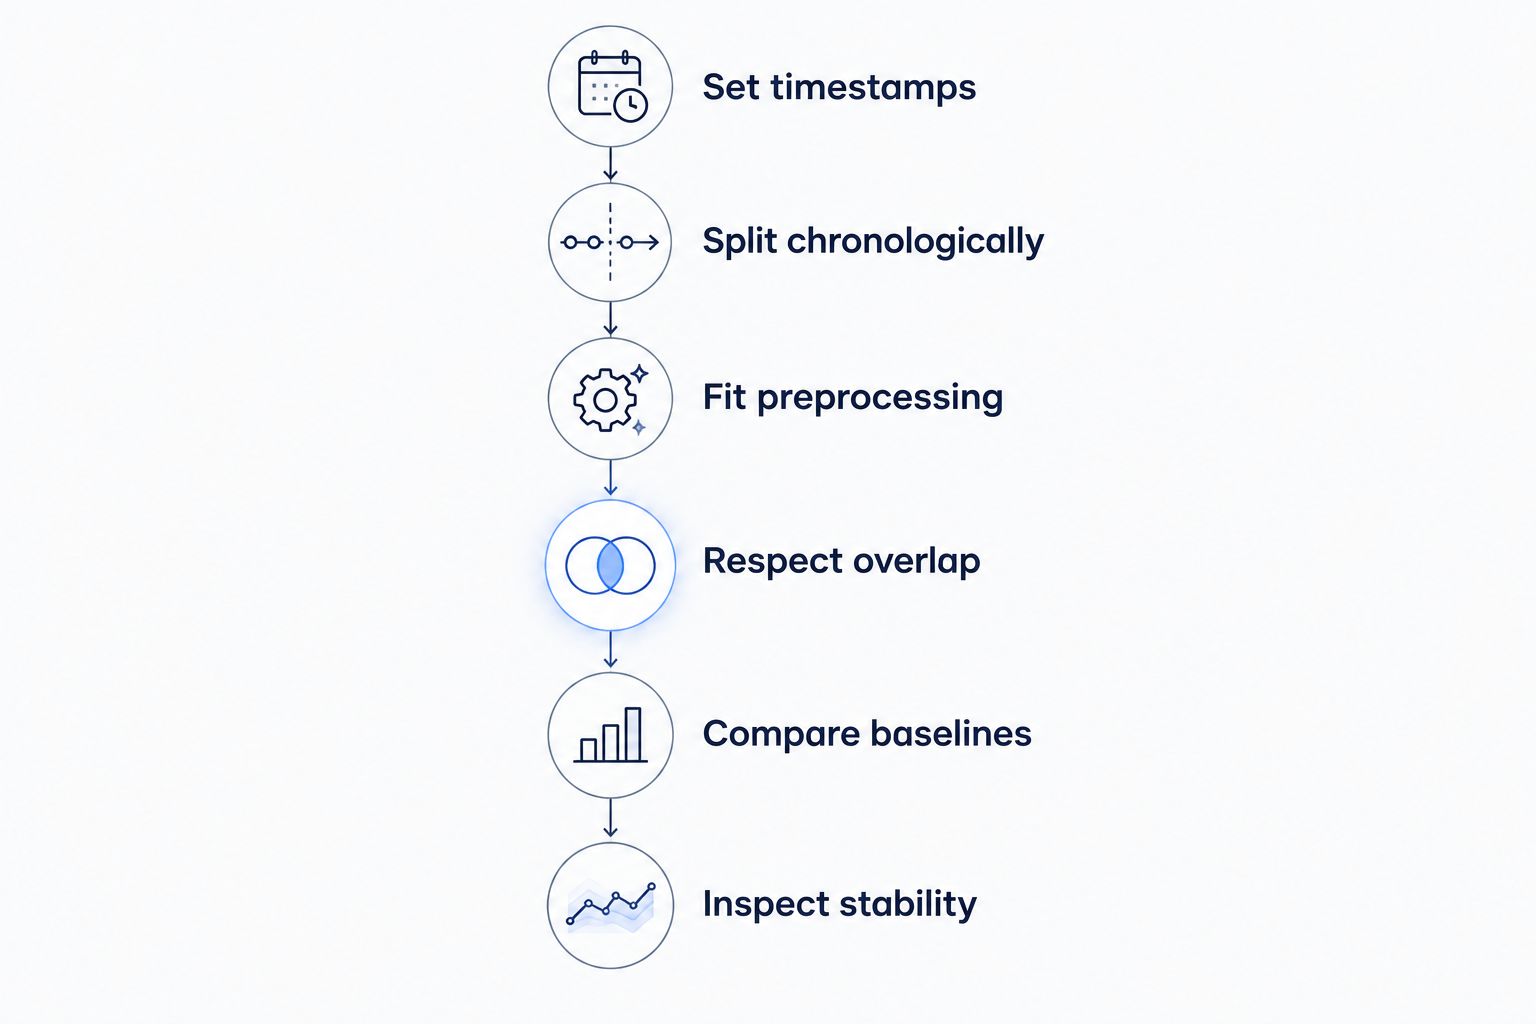
Use the following process when explaining a research design:
- Set timestamps. Specify the forecast origin, target interval, and when each input becomes available.
- Split chronologically. Place training observations before validation observations, and reserve a final test period.
- Fit preprocessing. Estimate scaling, imputation, feature selection, and model parameters inside each training window.
- Respect overlap. Remove training examples whose target intervals extend into the evaluation period when that overlap would contaminate the test.
- Compare baselines. Assess the model against a forecast appropriate to the target and loss function.
- Inspect stability. Examine performance across successive evaluation windows, not just an aggregate score.
An expanding window retains earlier training observations; a rolling window discards observations outside a chosen history. The former preserves more history, while the latter limits exposure to older observations. Neither is universally best, so explain the stability assumption behind your choice.
For your 2026 practice answers, include one explicit leakage check. For example, ask whether a revised economic release is being used instead of the version available at the historical forecast date.
Why does the right answer vary across questions?
The mathematical result follows from the stated assumptions. Your modeling recommendation changes with the problem:
- Target: Conditional mean, conditional variance, and long-run equilibrium require different interpretations.
- Horizon: A one-step forecast and a multi-step forecast use different error calculations and can create different label overlap.
- Observation structure: Irregular observations, missing values, and asynchronous measurements affect how lags are defined.
- Information timing: Release delays determine whether an input is usable at the forecast origin.
- Stability: Changing parameters challenge estimates based on a fixed historical relationship.
- Objective: Lower forecast error and better trading outcomes are different evaluation goals.
Do not respond to uncertainty by listing every model you know. State the missing assumption, explain its consequence, and give a conditional answer.
How should you answer common follow-up questions?
Does zero autocorrelation mean observations are independent?
Zero autocorrelation does not imply independence. A process can have uncorrelated observations while dependence remains in nonlinear functions such as squared observations.
That distinction explains why you inspect more than the residual autocorrelation function. Squared residual dependence can indicate conditional variance structure even when raw residual autocorrelation is small.
Should you model prices or returns?
Model the quantity your question requires. Returns are a natural target for a return forecast, while price levels can matter when studying integrated processes and cointegration.
Do not claim that returns are automatically independent or identically distributed. Transforming prices does not remove every form of temporal dependence.
Does a lower forecast error mean a better trading strategy?
A lower forecast error does not establish a better trading strategy. The answer also depends on the trading rule, risk, transaction costs, execution assumptions, and whether the signal was available before the trade.
Keep the claims separate. A model can improve a statistical loss function without producing an economically useful decision.
How should you practice explaining your answer?
For a 2026 rehearsal, use three exercises: a 60-second explanation, a 2-minute derivation, and a 5-minute research defense. These are practice constraints, not claims about interview duration.
In the short explanation, state the target, assumption, and conclusion. In the derivation, show the intermediate step that makes the result follow. In the research defense, explain the information timeline, baseline, validation design, and a reason to reject your own model.
QuantMinds is best for candidates seeking quant interview prep alongside resume review and one-on-one career coaching. Founded by a former UC Berkeley MFE program executive director, the firm addresses preparation within a broader quant recruiting process. Coaching does not replace the technical work: you still need to derive the results and defend your implementation.
Bring a specific weakness to QuantMinds: an assumption you cannot explain, a derivation you cannot finish, or a project whose validation you cannot defend. A concrete question gives the discussion a clear purpose.
FAQ
What's the best way to prepare for time series questions in a quant interview?
Practice defining the target, deriving a baseline, and defending chronological validation. Cover stationarity, AR models, conditional volatility, cointegration, and leakage, then explain how each changes a research decision.
Do I need to memorize every ARIMA formula?
Prioritize deriving and interpreting the core results over memorizing every formula. You should explain autoregressive terms, differencing, lagged innovations, and the assumptions behind your forecast.
Is an AR(1) process always stationary?
An AR(1) process has a stationary causal solution when |φ| < 1 under the standard finite-variance innovation assumptions. A unit-root process does not satisfy that condition.
Can I randomly split time series data for a forecasting interview exercise?
Use chronological evaluation when the task is forecasting later observations from earlier information. Random splitting does not reproduce that deployment setting and can contaminate evaluation through temporal dependence or overlapping targets.
What's the difference between autocorrelation and partial autocorrelation?
Autocorrelation measures association between observations at a given lag; partial autocorrelation measures their linear association after controlling for intervening lags. Interpret both alongside the model assumptions rather than treating their sample plots as proof of a model order.
Should I mention transaction costs in a time series interview answer?
Mention transaction costs when the question connects forecasts to a trading strategy. They are not part of a purely mathematical derivation unless the problem introduces them.
Can QuantMinds help with quant interview preparation?
QuantMinds offers quant interview prep, resume review, and one-on-one coaching for professionals and students targeting quantitative research, trading, and development roles. Use coaching to address specific preparation gaps while continuing your technical practice.
One last thing
Before your next mock interview, write the prediction timestamp beside every feature in a research project. Then ask whether the feature was actually observable at that moment, including publication delays and later revisions.
QuantMinds candidates should bring the information timeline, not just the backtest chart, into their quant interview preparation. A technically polished answer is stronger when you can identify exactly where future information would enter—and explain how you excluded it.